


Wholesale Prices, Week Ending Aug. 5
After three months of accelerated wholesale price drops, the first week of August brought the largest single-week decline in the overall market since October.
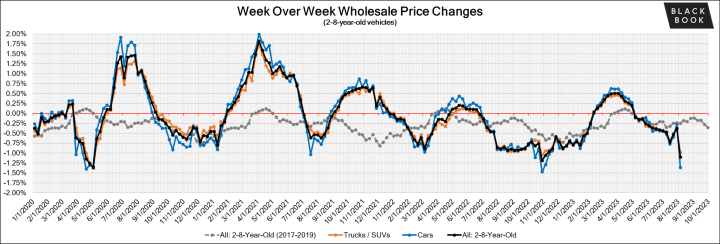
After three months of accelerated wholesale price drops, the first week of August brought the largest single-week price decline for the overall market since October, down 1.10%. All the segments and vehicle ages were affected, but more affordable older models didn't drop as much as the rest of the market. Retail asking prices are softening at a much lower rate, and the market is in a state of trying to find the new normal of pricing in both wholesale and retail.
This Week Last Week 2017-2019 Average (Same Week)
Car segments -1.36% -0.27% -0.31%
Truck & SUV segments -0.98% -0.41% -0.20%
Market -1.10% -0.37% -0.25%
On a volume-weighted basis, the overall car segment decreased 1.36%. In the previous week, cars decreased by 0.27%.
The 0- to 2-year-old car segments were down 1.13% and 8- to 16-year-old cars declined 1.02%.
All nine segments decreased.
Compact car had the largest decline, down 2.12%, compared with the prior week’s change of -0.66%. The segment has now had 11 consecutive weeks of declines, with an average weekly change of -0.67%.
Premium sporty car had the smallest drop last week, down 0.59%, though it was the largest drop for the segment since February.
The volume-weighted overall truck segment decreased 0.98%, an increase in depreciation compared to the prior week’s drop of 0.41%.
The 0- to 2-year-old models reported an accelerated decline last week of 0.97%, while the 8- to 16-year-olds declined only 0.55%.
All 13 truck segments reported a decrease.
The full-size crossover segment depreciated 2.25%, significantly more than the older 8- to 16-year-old full-size crossovers, which declined 0.73%.
The small pickup segment also had a large decline of 1.64%, compared with the prior six weeks, which have averaged 0.37% depreciation each week.
The graphic below looks at trends in wholesale prices of 2- to 6-year-old vehicles indexed to the first week of the year. The index is computed keeping the average age of the mix constant to identify market movements.
Used-retail prices are more accessible than in years past due to the proliferation of no-haggle pricing. Transparent pricing upfront makes the car-buying process more enjoyable for customers and allows Black Book to accurately measure retail market trends.At the onset of the pandemic, in CY2020, used-retail prices increased slightly, following typical seasonal patterns, then began dropping in April, finally hitting a low point in the late spring months. By late summer of CY2020, they increased as supply of new-vehicle inventory started to become scarce, but retail demand slowed at the end of CY2020, resulting in declining retail asking prices for the last several weeks of the year. When CY2021 kicked off, demand rebounded while retail prices lagged slightly behind wholesale; March 2021 started the dramatic increases in used-retail prices, fueled by stimulus payments, tax season and shortages of new inventory. During the third quarter, retail prices continued to rise at a slower rate but soon picked again to start the fourth quarter, when they steadily increased. As CY2021 ended, the retail listing price index closed 36% above where the year began. The index remained relatively stagnant through most of CY2022. In the fourth quarter of 2022, the Retail Listings Price Index started to decline but not as steeply as the wholesale price index.
This analysis is based on approximately two million vehicles listed for sale on U.S. dealer lots. The graphic below looks at 2- to 6-year-old vehicles. It's computed keeping the average age of the mix constant to identify market movements.
The Used Retail Active Listing Volume Index currently sits at 1.01 points.
The used-retail days-to-turn estimate is currently around 52.
The first week of August saw larger declines in car and truck segments than any time in the past 11 months. Even though the auction conversion rate was stable, wholesale prices dropped as sellers lowered their floors and buyers were unwilling to pay more than they had to. Is this a wakeup call or just a blip in the market in this wild world of the car business? As always, the Black Book team of analysts will keep their eyes on the market, watching for developing trends and insights.
The estimated average weekly sales rate stayed stable at 49% last week.
A handful of states see franchise growth through June, while EV sales per store boost overall business in U.S.
Read More →
Performance and profits start with people chosen and led the right way.
Read More →
Kerrigan metrics show there’s plenty of demand, though many sellers are waiting to pull the trigger.
Read More →
Company is providing a fully integrated F&I administration model to Nissan Extended Services North America’s dealer network.
Read More →
Despite incentive spending not keeping pace with deliveries volume, consumers make their purchases ahead of tariffs impact.
Read More →
Hybrid solution combines benefits of reinsurance and dealer-owned warranty companies.
Read More →
Understanding how it plays into inventory risk management is an important consideration.
Read More →
Kerrigan Advisors poll shows percentage of retailers expecting lower profits, valuations is on the rise.
Read More →
Says VW unit’s plans to sell directly to consumers violate state law.
Read More →
Take the time to answer these and lay the groundwork for a successful year-end.
Read More →