agent Entrepreneur logo
MenuMENU
SearchSEARCH

EV Surge Shows AI Steadied Softer Q3

StoneEagleData reveals the gross reality behind the rise in EV leasing and the steady role F&I offices played.

December 5, 2025
StoneEagle logo beside a headshot of Cindy Allen, CEO, on a pink background with a stylized upward-trending chart.

StoneEagle’s F&I Benchmark Report tracks third-quarter dealer performance and product trends.

Credit:

StoneEagle/ADT

3 min to read


Finance-and-insurance provider StoneEagle released its third-quarter StoneEagleData F&I Benchmark Report, which tracks deal performance across more than half of the automotive retail market.

The report found electric vehicles accounted for about 6% of franchised dealer transactions in the third quarter. Nearly 60% of EV deals were leases, reflecting how dealers continued to use leasing to support affordability during the final months of the federal EV tax credit.

Ad Loading...

Total gross per deal also trended lower, driven by a sharp drop in front gross as dealers discounted vehicles to close deals.

“EVs drew a lot of attention this period, but they were only a small slice of what we measured,” said StoneEagle CEO Cindy Allen. “The data shows dealers leaned on leasing to help consumers into EVs, while consistent F&I revenue helped offset softer front-end results.”

Third-Quarter Highlights

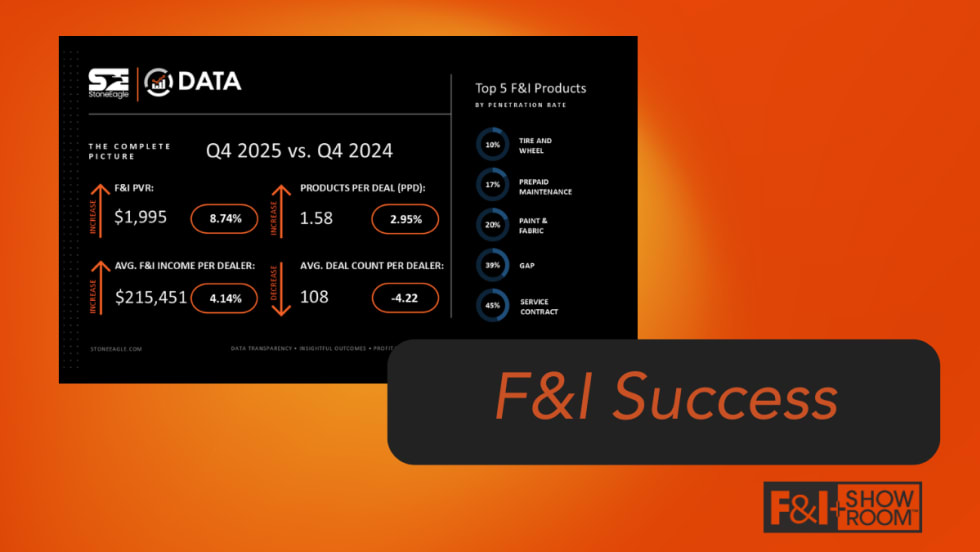
Results showed steady F&I performance across key metrics. Deal counts rose nearly 3% year-over-year, and total F&I income per dealer increased almost 12%. F&I profit per vehicle retailed increased 8% year-over-year, while average products per deal rose 2.5%. Those gains helped limit total gross per deal to a 2.1% decline despite a 26% drop in front gross year-over-year.

  • F&I profit per vehicle retailed: Averaged $1,933 per deal, up from $1,923 in the second quarter and $1,786 a year earlier

  • Products per deal: Averaged 1.56 products compared with 1.57 in the second quarter and 1.52 a year earlier

  • Average monthly F&I income per dealer: $222,677, up from $219,266 in the second quarter and $199,876 a year earlier

  • Average front gross: $560 per vehicle, down from $839 in the second quarter and $761 a year earlier but still roughly 30% above pre-COVID levels.

  • Total gross per vehicle: Averaged $2,493, down from $2,762 in the second quarter and $2,547 a year earlier

Product Performance, Mix

Product performance was steady, with service contracts and gap coverage continuing to anchor F&I revenue. Ancillary offerings held at roughly one-third of product-driven F&I revenue. Overall, product sales represented just over 60% of total F&I revenue for the quarter.

Ad Loading...
  • Vehicle service contracts: Held steady at 44% penetration compared with 45% in the second quarter and 44% a year earlier

  • Guaranteed Asset Protection: Reached 38%, consistent with the second quarter and up from 36% a year earlier

  • Paint-and-fabric protection: Averaged 20%, up from 19% a year earlier

  • Prepaid maintenance: Held at 16%, unchanged from both the second quarter and a year earlier

  • Tire-and-wheel protection: Averaged 10%, matching both the second quarter and a year earlier

“F&I product providers continue to refine their offerings, and we’re seeing that show up in the data,” said Colin Snyder, general manager of StoneEagle’s Automotive Retail Solutions. “The data points to continued interest in bundled product and appearance packages when they’re presented clearly and consistently.”

More Industry

F&Iby Lauren LawrenceFebruary 27, 2026

Price Driving Insurance Churn

Over half of insurance holders ages 18 to 29 reported to be 'somewhat' likely to change providers in the next 90 days, according to CivicScience, which found that interest was lower among older age groups.

Read More →
Industryby Lauren LawrenceFebruary 26, 2026

AI Drives Dealer Website Traffic

Total visits to dealer websites from generative artificial intelligence platforms grew more than 15 times year-over-year, signaling a shift in how many consumers shop for cars online.

Read More →
Industryby Hannah MitchellFebruary 26, 2026

Automakers Tops in Fuel Economy

In the U.S., Honda has the most efficient gas-electrified combo lineup while Tesla beats all automakers in annual EPA ranking as brands built their alternative-fuel offerings.

Read More →
Ad Loading...
F&Iby Lauren LawrenceFebruary 25, 2026

Report Finds Year-End F&I Strength

Deal volume ebbed and flowed throughout 2025, but product performance remained steady, according to automotive technology and data intelligence solutions provider StoneEagle.

Read More →
Industryby Hannah MitchellFebruary 24, 2026

Overall Consumer Confidence Up

Americans’ view of present business conditions, the labor market and family finances, though, are still in the dumps, and if they plan to buy cars, many target used units.

Read More →
Auto Financeby Lauren LawrenceFebruary 23, 2026

Auto Loan Forecast Bucks Market Trend

Auto loan originations rose over 6% year-over-year in the third quarter of 2025, but TransUnion predicts a slight decline in auto loan growth this year, making it an outlier in the company's overall lending forecast.

Read More →
Ad Loading...
F&Iby Hannah MitchellFebruary 23, 2026

Some Auto Brands Cheaper to Insure

A new top 10 list ranks the least expensive for average full insurance coverage on a clean driving record and high driver credit scores.

Read More →
Industryby StaffFebruary 20, 2026

Learn to Manage the Mayhem at Agent Summit

Rob Mancuso – president of Mancuso Automotive – will present a Keynote at the 2026 event.

Read More →
Fixed Opsby Hannah MitchellFebruary 20, 2026

Auto Recalls Sank Last Year

2025 Sedgwick data indicate that the number of vehicles affected fell to its lowest point in more than a decade.

Read More →
Ad Loading...
Industryby Lauren LawrenceFebruary 19, 2026

Affordability Leads Top-Rated List

Edmunds’ editorial team tested 300-plus vehicles to help determine the Top Rated Awards for 2026, and one brand stood out with multiple rankings, including Best of the Best.

Read More →